5PCGoodland
0.1300.010+8.33%88.00K11.33K0.1200.1200.1300.12046.68M6.99M359.07M53.74M+14.04%+13.04%+23.40%+21.21%+8.31%+3.10%+15.10%1.54%0.16%LossLoss8.33%Real Estate
5DMYing Li Intl
0.0230.001+4.55%180.00K4.14K0.0230.0220.0230.02358.81M14.22M2.56B618.36M0.00%+15.00%-8.00%-20.69%-48.89%+21.05%-30.30%--0.03%LossLoss0.00%Real Estate
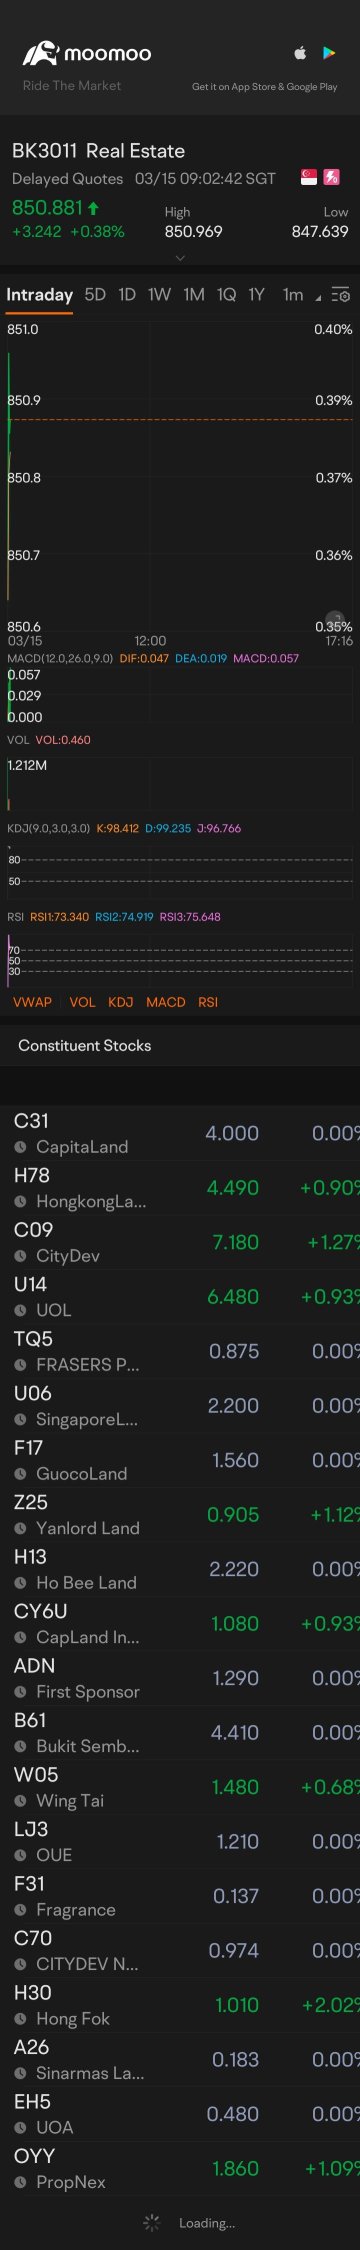
ADNFirst Sponsor
1.0500.040+3.96%200.00209.001.0401.0101.0501.0401.19B165.53M1.13B157.65M+2.94%+0.96%+2.94%+0.96%-1.78%-12.88%-4.55%4.00%0.00%13.2913.290.99%Real Estate
BJVYamada Green Res
0.1160.004+3.57%600.0069.000.1110.1120.1160.11120.48M4.78M176.52M41.19M-4.13%-4.92%-4.13%+5.45%-17.14%-29.04%-7.20%--0.00%LossLoss4.46%Real Estate
C09CityDev
5.0500.150+3.06%4.42M22.26M4.9304.9005.1204.9304.51B1.70B893.40M337.04M+10.02%+16.09%+0.20%-0.20%-3.26%-10.49%-1.17%1.58%1.31%23.7123.713.88%Real Estate
F17GuocoLand
1.4200.020+1.43%64.60K91.39K1.4101.4001.4201.4101.64B204.24M1.15B143.83M+2.16%+2.16%-3.40%-2.74%-7.19%+1.07%-2.74%4.23%0.05%13.2714.340.71%Real Estate
Z25Yanlord Land
0.4650.005+1.09%1.99M927.27K0.4650.4600.4750.460898.16M234.83M1.93B505.01M+6.90%+17.72%-4.12%-17.70%-32.12%+14.81%-29.55%--0.39%LossLoss3.26%Real Estate
CY6UCapLand India T
0.9500.010+1.06%1.46M1.39M0.9400.9400.9500.9401.28B1.06B1.35B1.11B+0.53%+11.76%-1.55%-5.81%-10.95%+1.79%-8.45%7.05%0.13%2.902.901.06%Real Estate
W05Wing Tai
1.1400.010+0.88%18.10K20.63K1.1401.1301.1501.130869.74M323.22M762.93M283.53M+3.64%+10.68%-3.39%-7.32%-12.98%-21.72%-8.06%2.63%0.01%LossLoss1.77%Real Estate
C70CITYDEV NCCPS
0.9880.008+0.82%57.00K56.16K0.9850.9800.9880.985882.68M332.99M893.40M337.04M+2.38%+0.71%+1.23%-1.30%+1.88%+5.30%-1.00%--0.02%0.000.000.31%Real Estate
U14UOL
5.8000.040+0.69%916.90K5.31M5.7705.7605.8305.7504.90B1.85B844.94M319.39M+4.88%+6.62%0.00%+14.17%+7.81%+3.71%+12.40%2.59%0.29%13.6813.681.39%Real Estate
C33Chuan Hup
0.1570.001+0.64%5.00K783.000.1560.1560.1570.156143.62M56.53M914.79M360.05M+3.97%+3.97%+3.97%+0.64%+0.85%-4.91%+0.64%6.37%0.00%39.2552.330.64%Real Estate
U06SingaporeLandGrp
1.9800.010+0.51%75.70K149.55K1.9601.9702.0001.9602.84B319.18M1.43B161.20M+3.66%+9.39%-1.00%+4.21%+12.50%+11.88%+12.50%2.02%0.05%10.0010.002.03%Real Estate
B61Bukit Sembawang
3.4700.010+0.29%27.10K94.21K3.5003.4603.5003.470898.42M504.24M258.91M145.31M+1.46%+8.10%-4.41%-1.98%-3.61%+10.79%-2.53%1.15%0.02%8.2812.660.87%Real Estate
CEDUDasin Retail Tr
0.0210.0000.00%1.80K36.000.0210.0210.0210.02116.89M9.74M804.47M463.70M+5.00%+5.00%+10.53%-27.59%-44.74%-58.00%-34.38%--0.00%LossLoss0.00%Real Estate
UV1Regal Intl
0.1150.0000.00%0.000.000.0000.1150.0000.00025.87M25.13M224.92M218.53M+4.55%+15.00%+13.86%+4.55%-15.44%+666.67%+49.35%--0.00%Loss7.670.00%Real Estate
S9BAmcorp Global
0.1150.0000.00%0.000.000.0000.1150.0000.00051.45M5.08M447.40M44.22M0.00%0.00%0.00%+4.55%-4.17%-25.81%0.00%--0.00%LossLoss0.00%Real Estate
S3NOKH Global
0.0430.0000.00%17.78M768.93K0.0430.0430.0440.04248.53M17.62M1.13B409.74M+4.88%+19.44%0.00%+65.38%+258.33%+95.45%+59.26%--4.34%10.7514.334.65%Real Estate
S2DTosei
9.5000.0000.00%0.000.000.0009.5000.0000.000460.38M460.38M48.46M48.46M+0.00%+0.00%+0.00%+0.00%+0.00%+0.00%+0.00%7.44%0.00%4.304.300.00%Real Estate
PH0Hatten Land
0.0110.0000.00%0.000.000.0000.0110.0000.00020.43M6.61M1.86B601.16M-8.33%0.00%-8.33%-15.38%-26.67%-38.89%-31.25%--0.00%LossLoss0.00%Real Estate
P36Pan Hong
0.0980.0000.00%0.000.000.0000.0980.0000.00050.21M15.75M512.31M160.71M+6.52%+13.95%+19.51%+34.25%+50.77%-14.04%+15.29%--0.00%24.508.910.00%Real Estate
OYYPropNex
1.1000.0000.00%383.70K421.54K1.1001.1001.1101.090814.00M170.31M740.00M154.83M+0.92%+4.76%-3.51%+4.76%+39.24%+28.62%+16.40%5.27%0.25%20.0020.001.82%Real Estate
H30Hong Fok
0.7100.0000.00%205.70K146.72K0.7150.7100.7200.710581.70M199.75M819.30M281.34M+2.90%+13.60%-7.19%-11.25%-15.48%-12.90%-13.41%1.41%0.07%19.1919.191.41%Real Estate
F86MYP
0.0400.0000.00%31.00K1.24K0.0400.0400.0400.04063.70M6.46M1.59B161.61M0.00%-11.11%-14.89%-18.37%-2.44%0.00%-20.00%--0.02%LossLoss0.00%Real Estate
F1ELow Keng Huat
0.3050.0000.00%0.000.000.0000.3050.0000.000225.34M50.51M738.82M165.60M+1.67%-6.15%-1.61%0.00%+7.02%-5.57%-3.17%4.92%0.00%101.67101.670.00%Real Estate
EH5UOA
0.4500.0000.00%0.000.000.0000.4500.0000.000750.19M59.39M1.67B131.99M+2.27%+1.12%-1.25%+12.11%-11.81%-18.73%-8.16%4.67%0.00%9.579.570.00%Real Estate
CLNAPAC Realty
0.4050.0000.00%10.00K4.05K0.4050.4050.4050.405145.48M35.73M359.20M88.22M+2.53%+9.46%-5.81%-10.99%+3.85%-5.76%+5.19%5.68%0.01%20.2520.250.00%Real Estate
BTFDebao Property - watch list
0.1280.0000.00%0.000.000.0000.1280.0000.0009.60M9.28M75.00M72.52M-27.76%-31.04%-31.04%+5.35%-43.81%+126.42%-34.04%--0.00%LossLoss0.00%Real Estate
BTEBund Center
0.3500.0000.00%400.00140.000.3550.3500.3550.350265.57M39.69M758.77M113.40M-1.41%-9.09%-5.41%-4.11%-7.16%-13.79%-9.09%4.00%0.00%19.4419.441.43%Real Estate
BJLLCT
0.5800.0000.00%0.000.000.0000.5800.0000.00020.44M12.40M35.24M21.38M0.00%0.00%0.00%-0.85%+30.34%+16.00%+38.10%--0.00%96.6796.670.00%Real Estate