SAPSAP SE
271.48019.080+7.56%2.81M770.75M273.630252.400277.979270.260316.84B278.99B1.17B1.03B+3.63%+14.29%-3.12%-1.49%+12.98%+46.21%+10.26%0.84%0.27%90.5290.523.06%Software - Application
SHOPShopify
90.9605.250+6.13%14.03M1.30B91.53085.71095.45089.920117.78B109.88B1.29B1.21B+8.40%+17.99%-17.17%-15.29%+13.89%+22.90%-14.45%--1.16%58.6858.686.45%Software - Application
NOWServiceNow
812.70045.870+5.98%3.02M2.49B821.040766.830833.965807.000168.21B166.96B206.98M205.44M-0.47%+11.70%-5.65%-28.75%-14.00%+9.68%-23.34%--1.47%110.27118.823.52%Software - Application
DOCUDocuSign
78.0103.810+5.13%1.65M129.12M78.27574.20080.60077.62515.80B15.62B202.50M200.20M+0.67%+10.89%-12.73%-15.45%+12.12%+37.56%-13.26%--0.82%15.3615.364.01%Software - Application
CRWDCrowdStrike
385.75017.300+4.70%3.58M1.39B382.500368.450396.305382.50095.62B89.02B247.87M230.77M-1.79%+18.68%+0.21%+3.21%+28.02%+28.73%+12.74%--1.55%LossLoss3.75%Software - Infrastructure
GDDYGoDaddy
178.0107.820+4.59%1.50M266.14M175.460170.190179.380174.50525.16B24.98B141.36M140.33M+1.72%+9.81%-3.36%-13.14%+11.33%+44.25%-9.81%--1.07%27.6027.602.86%Software - Infrastructure
HUBSHubSpot
565.96024.140+4.46%852.75K484.33M570.070541.820584.140561.14029.52B28.44B52.15M50.25M+3.43%+16.20%-9.75%-25.38%+1.41%-13.17%-18.77%--1.70%6288.446288.444.25%Software - Application
AMZNAmazon
180.6007.420+4.28%63.47M11.62B183.450173.180187.380180.1901.91T1.69T10.60B9.38B+0.56%+5.82%-12.21%-23.29%-4.14%+0.59%-17.68%--0.68%32.6632.664.15%Internet Retail
OKTAOkta
98.3304.000+4.24%2.38M236.12M98.68094.330101.31097.87017.07B16.20B173.60M164.78M-1.88%+7.59%-15.76%+8.17%+34.24%+4.20%+24.78%--1.44%1638.831638.833.65%Software - Infrastructure
TEAMAtlassian
208.2707.970+3.98%1.81M381.39M211.300200.300218.090206.45054.57B33.83B262.00M162.43M+0.49%+13.29%-11.83%-22.29%+10.39%+4.43%-14.43%--1.12%LossLoss5.81%Software - Application
TWLOTwilio
87.1303.260+3.89%1.95M171.59M88.60083.87090.52086.81013.30B12.55B152.63M144.07M-1.34%+7.12%-17.72%-37.31%+23.43%+44.42%-19.38%--1.35%LossLoss4.42%Software - Infrastructure
PAYCPaycom Software
219.2307.710+3.65%393.95K86.72M215.880211.520224.280215.88012.68B11.21B57.85M51.13M-0.03%+13.55%-1.88%+3.15%+31.45%+17.47%+7.15%0.68%0.77%24.5824.583.97%Software - Application
DDOGDatadog
94.5803.160+3.46%5.87M557.57M95.24091.42097.26093.92032.66B29.60B345.33M312.98M+2.19%+8.71%-14.47%-33.47%-25.16%-25.20%-33.81%--1.88%181.88181.883.65%Software - Application
ORCLOracle
131.4004.160+3.27%9.53M1.27B134.910127.240135.870130.990368.48B212.48B2.80B1.62B-1.90%+5.92%-14.33%-16.68%-23.33%+15.45%-20.67%1.22%0.59%30.8535.423.84%Software - Infrastructure
TTDThe Trade Desk
50.0801.420+2.92%8.85M452.93M51.00048.66052.67049.94124.84B22.42B496.09M447.66M+1.71%+10.63%-19.23%-57.95%-57.91%-38.23%-57.39%--1.98%64.2164.215.61%Software - Application
CRMSalesforce
250.4807.090+2.91%5.82M1.47B252.610243.390257.790249.500240.71B232.74B961.00M929.16M-1.75%+2.82%-13.08%-27.72%-14.50%-8.94%-24.96%0.64%0.63%39.3839.383.41%Software - Application
AIC3.ai
20.3900.530+2.67%3.92M80.56M20.54519.86021.03020.1002.71B2.37B132.74M116.38M+2.10%+11.79%-13.23%-34.52%-22.59%-8.69%-40.78%--3.37%LossLoss4.68%Software - Infrastructure
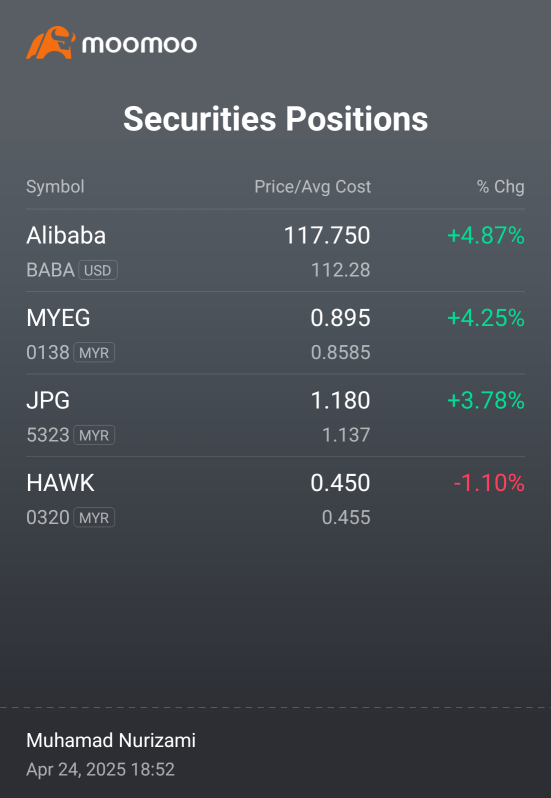
BABAAlibaba
118.9703.090+2.67%25.76M3.10B119.590115.880123.810118.750284.09B263.72B2.39B2.22B+5.96%+19.72%-10.38%+32.20%+19.05%+67.64%+40.31%0.84%1.16%17.3927.744.37%Internet Retail
RNGRingCentral
23.5100.610+2.66%986.70K23.41M23.75022.90024.28023.4602.13B1.71B90.72M72.53M+4.16%+9.30%-15.55%-32.54%-31.04%-22.99%-32.85%--1.36%LossLoss3.58%Software - Application
RTCBaijiayun
0.19960.0050+2.57%1.61M314.68K0.20700.19460.20700.18105.86M2.35M29.36M11.80M-14.55%+2.04%-37.57%-82.94%-97.55%-96.73%-94.47%--13.65%LossLoss13.36%Software - Application
GOOGLAlphabet-A
155.3503.880+2.56%31.13M4.85B155.610151.470157.525153.8101.89T1.70T12.19B10.94B-0.61%+7.36%-8.92%-18.92%-6.61%-1.37%-17.84%0.39%0.29%19.3219.322.45%Internet Content & Information
GOOGAlphabet-C
157.7203.820+2.48%18.58M2.94B157.910153.900160.020156.3501.92T1.73T12.19B10.94B-0.60%+7.60%-8.72%-18.51%-6.10%-0.91%-17.09%0.38%0.17%19.6219.622.39%Internet Content & Information
VEEVVeeva Systems
220.5304.750+2.20%1.12M246.96M220.480215.780225.605219.00035.88B32.90B162.70M149.16M-0.98%+5.32%-8.35%-2.32%+3.96%+9.66%+4.89%--0.75%51.0551.053.06%Health Information Services
INTUIntuit
596.05012.490+2.14%1.74M1.05B597.000583.560608.725593.810166.63B162.57B279.56M272.75M+0.33%+9.75%-3.50%-1.57%-2.29%-4.91%-4.84%0.65%0.64%55.7657.152.56%Software - Application
MSFTMicrosoft
374.3907.570+2.06%20.55M7.73B376.060366.820380.390373.0202.78T2.78T7.43B7.42B-2.94%+5.59%-5.26%-13.67%-11.88%-7.44%-11.00%0.82%0.28%30.1731.732.01%Software - Infrastructure
WDAYWorkday
224.8703.880+1.76%1.66M374.36M226.000220.990230.760223.72059.82B47.83B266.00M212.72M-3.62%+6.84%-11.06%-14.89%-4.29%-12.44%-12.85%--0.78%115.32115.323.19%Software - Application
ZMZoom Communications
72.8301.095+1.53%1.51M110.66M73.23071.73574.76072.26022.23B19.04B305.23M261.46M+0.59%+9.19%-6.78%-11.18%-1.38%+18.19%-10.76%--0.58%22.6922.693.49%Software - Application
ADSKAutodesk
264.4403.300+1.26%1.02M271.83M265.490261.140270.800263.58056.33B56.17B213.00M212.41M-0.34%+10.72%-3.16%-11.58%-7.71%+21.34%-10.53%--0.48%51.6551.652.77%Software - Application
JGAurora Mobile
8.1700.080+0.99%12.54K104.49K8.2508.0908.4808.17049.64M16.78M6.08M2.05M-3.08%-0.61%-18.95%-43.77%+12.53%+160.19%+15.58%--0.61%LossLoss3.83%Software - Infrastructure
ADBEAdobe
351.9602.050+0.59%3.17M1.12B358.120349.910363.000349.800150.01B149.59B426.20M425.02M+0.45%+3.52%-12.80%-19.75%-26.83%-25.57%-20.85%--0.75%23.2528.483.77%Software - Application