WAVEEco Wave Power
6.0400.310+5.41%38.18K235.58K5.9805.7306.3205.77235.28M17.66M5.84M2.92M+0.83%+2.72%-16.23%-31.83%-40.49%+71.59%-45.09%--1.31%LossLoss9.56%Utilities - Renewable
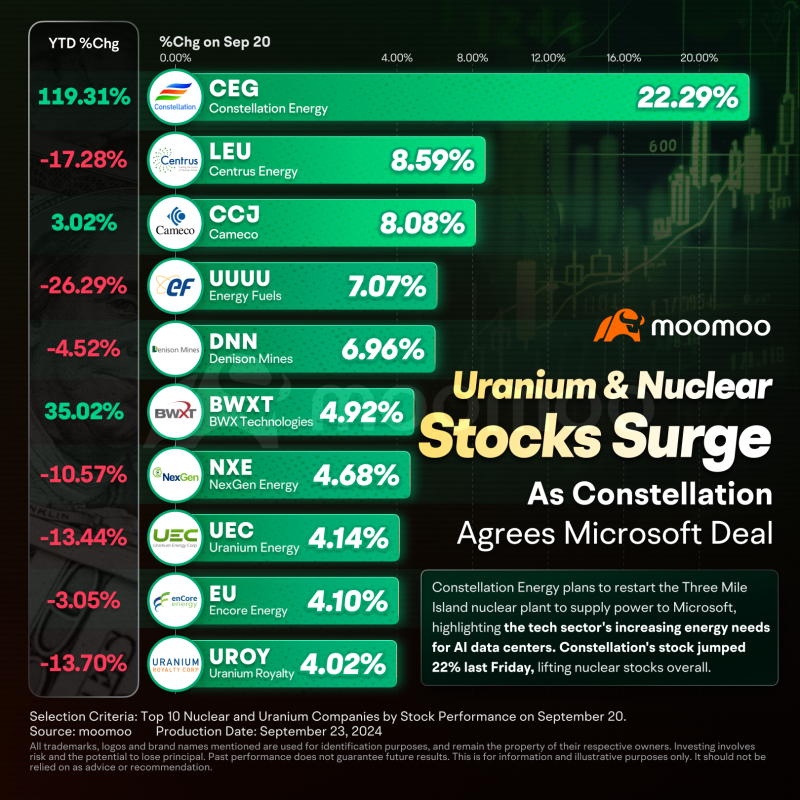
CEGConstellation Energy
209.8008.920+4.44%2.98M629.85M213.250200.880217.340208.27065.64B65.46B312.85M312.03M+0.66%+13.44%-7.52%-23.57%-21.15%+12.21%-6.04%0.67%0.95%17.6517.654.52%Utilities - Renewable
EBR.BCentrais Eletricas Brasileiras - Prefer
8.2900.290+3.62%20.75K169.24K8.0678.0008.2908.00018.63B9.89B2.25B1.19B+7.11%+13.41%+4.67%+24.66%+17.28%+8.17%+29.94%7.21%0.00%10.5210.523.63%Utilities - Renewable
GEVGE Vernova
336.09010.020+3.07%5.44M1.87B354.040326.070358.880333.19092.12B91.59B274.09M272.51M+2.37%+17.24%+0.04%+1.92%+16.38%+127.69%+2.25%0.07%2.00%47.3859.747.88%Utilities - Renewable
BNRGBrenmiller Energy
1.4000.030+2.19%28.35K39.67K1.4201.3701.4201.36011.33M7.55M8.09M5.39M-4.11%+15.70%-3.45%-7.89%+61.29%-39.66%+7.69%--0.53%LossLoss4.38%Utilities - Renewable
STEMStem Inc
0.40650.0065+1.63%3.27M1.34M0.40000.40000.42770.390166.73M63.77M164.15M156.88M+23.86%+18.89%+1.63%-43.31%-29.29%-76.09%-32.59%--2.08%LossLoss9.40%Utilities - Renewable
ENLTEnlight Renewable Energy
16.1500.190+1.19%2.10K33.37K16.18015.96016.18015.7301.92B48.45119.10M3.00+6.53%+7.49%+1.57%+0.25%+1.64%-2.56%-6.35%--69900.00%44.8644.862.82%Utilities - Renewable
EBRBrazilian Electric Power
7.4600.070+0.95%1.52M11.39M7.5007.3907.5507.43516.77B9.06B2.25B1.21B+4.48%+9.71%+1.77%+20.71%+13.65%+5.97%+30.42%2.77%0.13%9.479.471.56%Utilities - Renewable
HTOOFusion Fuel Green
0.24200.0020+0.83%97.58K24.12K0.25500.24000.25800.24005.67M3.64M23.45M15.04M-1.75%+5.22%-9.53%-44.62%-63.93%-80.16%-57.01%--0.65%LossLoss7.50%Utilities - Renewable
NXXTNextNRG
3.4200.020+0.59%68.88K236.26K3.4003.4003.5403.300383.04M75.94M112.00M22.20M+17.93%+35.71%+12.13%+9.97%+25.52%-43.24%+10.32%--0.31%LossLoss7.06%Utilities - Renewable
BEPBrookfield Renewable Partners LP
22.1000.110+0.50%454.27K10.11M22.33021.99022.59022.0006.30B4.64B284.92M210.12M+4.15%+9.62%-5.47%+6.18%-16.30%+8.05%-1.42%6.43%0.22%LossLoss2.68%Utilities - Renewable
XIFRXPLR Infrastructure LP
8.4900.040+0.47%1.06M9.10M8.6708.4508.8408.370797.74M773.84M93.96M91.15M-2.97%+6.66%-13.54%-46.27%-56.45%-67.01%-52.30%42.34%1.17%LossLoss5.56%Utilities - Renewable
SUUNSolarBank
2.1500.010+0.47%182.42K405.87K2.1302.1402.2702.13075.05M53.49M34.91M24.88M-5.70%-10.04%-23.49%-11.52%-38.75%-63.31%+4.88%--0.73%LossLoss6.54%Utilities - Renewable
CREGSmart Powerr
0.67140.0015+0.22%41.81K27.88K0.66100.66990.68000.640116.66M14.95M24.81M22.27M+9.17%+27.40%-6.75%+3.88%-15.01%-43.10%-12.58%--0.19%LossLoss5.96%Utilities - Renewable
AMPSAltus Power (Delisted)
4.9900.0000.00%0.000.000.0004.9900.0000.000800.50M269.70M160.42M54.05M+0.60%+0.60%+1.01%+30.97%+38.23%+34.14%+22.60%--0.00%499.00499.000.00%Utilities - Renewable
ELLOEllomay Capital
14.9160.0000.00%3.0044.0014.23914.9160.0000.000191.71M50.20M12.85M3.37M+1.47%+11.31%-1.55%-6.78%+6.92%-1.61%-8.21%--0.00%LossLoss0.00%Utilities - Renewable
CWENClearway Energy-C
28.150-0.070-0.25%1.08M30.43M28.56028.22028.79027.9003.31B3.27B117.45M116.32M-3.16%+5.27%-7.46%+11.51%+10.84%+26.62%+9.96%5.88%0.93%37.5337.533.15%Utilities - Renewable
BEPCBrookfield Renewable
27.420-0.120-0.44%724.02K20.00M28.00027.54028.32527.3004.92B4.65B179.61M169.41M+2.62%+11.96%-5.58%+11.28%-12.46%+27.07%+1.87%5.18%0.43%20.8720.873.72%Utilities - Renewable
CWEN.AClearway Energy-A
26.270-0.160-0.61%185.24K4.89M26.74026.43026.86026.0703.09B3.06B117.45M116.44M-3.21%+5.29%-8.15%+10.31%+10.96%+27.30%+9.22%6.30%0.16%35.0335.032.99%Utilities - Renewable
FLNCFluence Energy
3.670-0.040-1.08%4.97M18.31M3.8403.7103.9603.560477.28M228.70M130.05M62.32M-0.14%-5.90%-32.29%-73.19%-82.36%-77.40%-76.89%--7.98%Loss28.2310.78%Utilities - Renewable
ORAOrmat Technologies
71.640-0.860-1.19%380.08K27.29M73.00072.50073.31570.9654.34B4.12B60.61M57.46M+0.79%+7.89%+0.59%+11.07%-11.75%+10.64%+5.97%0.67%0.66%35.1235.123.24%Utilities - Renewable
RNWReNew Energy Global
6.340-0.090-1.40%550.44K3.51M6.4406.4306.5406.3202.30B438.71M362.63M69.20M+3.26%+13.01%+1.60%-5.65%+6.38%+9.12%-7.17%--0.80%134.8954.663.42%Utilities - Renewable
VGASVerde Clean Fuels
3.250-0.130-3.85%4.01K13.15K3.5703.3803.5703.17971.66M13.71M22.05M4.22M-10.22%+11.30%-7.14%-7.67%-14.92%-28.57%-20.05%--0.10%LossLoss11.57%Utilities - Renewable
NRGVEnergy Vault
0.6460-0.0441-6.39%1.38M907.47K0.74000.69010.74000.632799.64M66.94M154.24M103.63M-7.75%-4.04%-27.62%-62.22%-62.44%-46.61%-71.67%--1.33%LossLoss15.55%Utilities - Renewable